Treemaps
IT Visibility is being upgraded with the introduction of Technology Intelligence Platform beginning in September 2024. Flexera will contact you directly regarding the timeframe of your upgrade. With Technology Intelligence Platform, out-of-the-box IT Visibility dashboards are being replaced with new, enhanced IT Visibility Technology Intelligence Platform reports. For more information, see IT Visibility With Technology Intelligence Platform Reports.
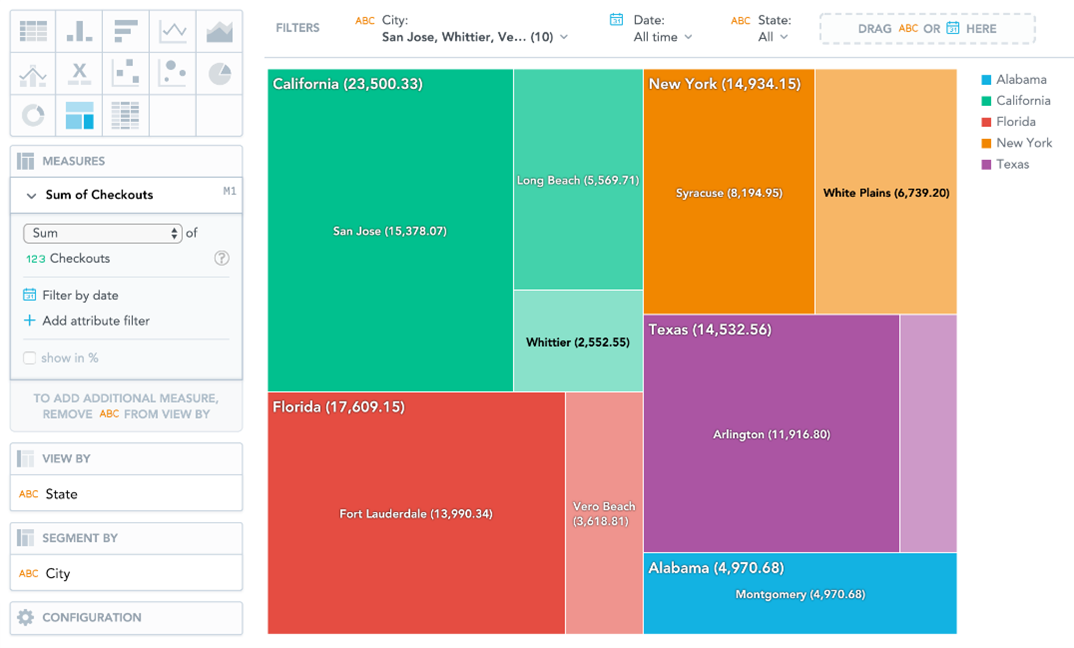
Treemaps display your data hierarchically as nested rectangles. Treemap are useful for comparing proportions within the hierarchy.
Treemap have the following sections: Measures, View by, Segment by, and Configuration.
-
In Treemap, you can also:
-
Display the values as a percentage. You must add Dates or Attributes to the View by section.
-
Segment the Treemap by attributes. The Treemap shows the attributes as different shades of a color. To add attributes to the Segment by section, you must have only a single item in the Measures section.
-
Slice your data by attribute or date. You must add Date or an Attribute to the View by section.
For information about common characteristics and settings of all insights, see Insight Types.